
Two independent axes, pick each separately
A deployment is defined by two orthogonal choices. Conflating them is the most common sizing mistake:Availability tier (T0 → T4)
The failure domain you survive, node → zone → region. This is what the
tiers below set, and it drives your SLA. It changes topology, not capacity.
Concurrency (sizing)
How many users/requests you serve. This sizes CPU, memory, disk, replicas,
and shards, within any tier. The platform and inference layers scale
independently (see Hardware Requirements).
The per-tier user counts below are typical pairings, not caps. 10,000 users
doesn’t force T4, you go to T4 to survive a region outage, not to hold more
users. Need 10,000 users but single-region resilience is acceptable? Run a T2/T3
topology sized for 10,000. Pick the tier for failure domains; size for concurrency
separately.
The tier ladder
Per-tier reference architectures
- T0 · Single-Node
- T1 · Essential
- T2 · Standard HA
- T3 · Multi-AZ
- T4 · Multi-Region
AI-in-a-Box, dev / PoC only. Every component on one node. No HA and no
backup by design, data is disposable (RPO unbounded). Use only where outage
and potential data loss are acceptable.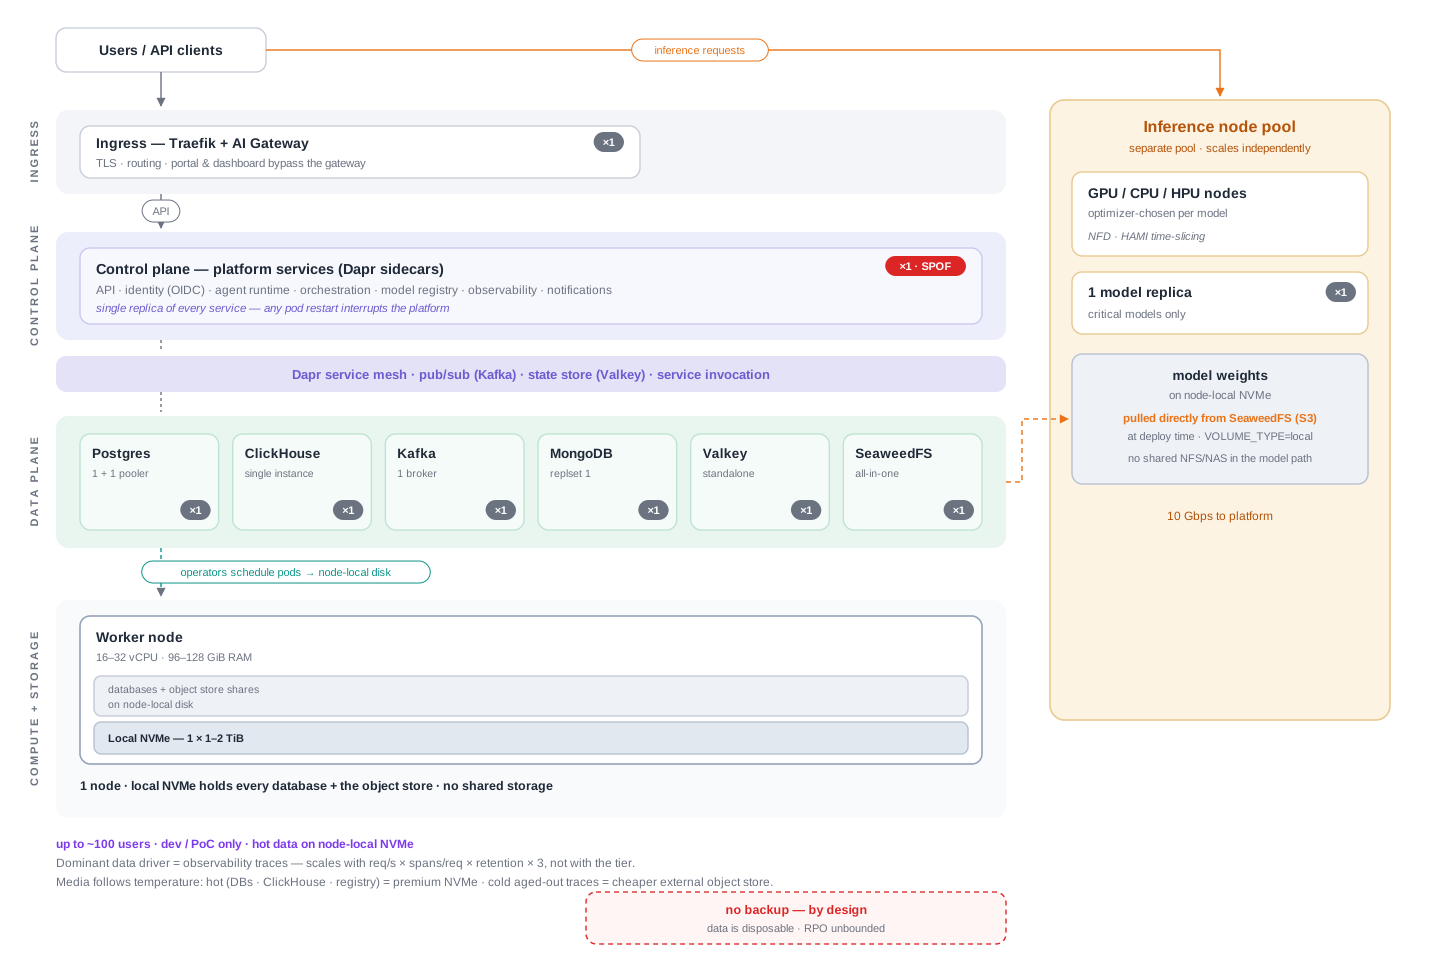


Sizing the storage, the bare-minimum volume math
The dominant, variable storage driver is observability traces, and it scales with throughput × retention, not the tier. Total storage is the sum of four components, don’t size on traces alone:From concurrency to terabytes
1
Concurrency → req/s
req/s = concurrency ÷ avg request seconds. An agent request runs ~15 s
(multi-step), so 1,000 concurrent users ≈ 67 req/s. Use your own measured
request duration if it differs.2
req/s → TB
TB ≈ (spans/req × 385 B × req/s × 86,400 × retention-days × 3 (replicas) × 1.3 (merge)) ÷ 10¹²
(the ÷ 10¹² converts bytes to TB).
Agent invocations average ~15 spans/req; traces are ~90% of per-request storage.Sized for the agent workload (~15 s/request, ~15 spans). The two levers that move
these numbers most are the retention window (linear) and spans per request
(fewer spans → proportionally less), see the knobs below. Plug your own measured
request duration and span count into the formula for an exact figure.
What the “external object store” actually is
Bud reaches object storage through a plain S3 API (externalServices.s3:
endpoint + keys + bucket). By default it’s SeaweedFS, in-cluster, running on the
same nodes’ NVMe, so there is no external store until you add one. The “external”
store is simply a separate S3-compatible object store you stand up and operate
yourself, then point that config at:
- Self-hosted SeaweedFS (most common on-prem), a small cluster of cheap-disk nodes (HDD / standard-SSD, erasure-coded ≈ 1.5× raw). The same stack Bud runs in-cluster, stood up separately on cheap-disk nodes.
- Ceph / RADOS-GW, any S3-compatible store you already operate works too.
- Cloud bucket (AWS S3 / Azure Blob), only where the deployment isn’t air-gapped.
Scaling up or down, the knobs
Through T3 you stay at the 3-node HA floor, you scale by fitting bigger NVMe
into each node’s
vg1 pool, not by adding nodes. Only at T4 does trace volume
start to drive node count. And even at T4 you can stay all-NVMe (~5–6 big-NVMe
nodes), you tier cold traces to external object storage to save cost, not because
it won’t fit.Next steps
Hardware Requirements
The underlying compute, memory, storage, and inference capacity model
Helm Configuration
Configure resources, retention, replicas, and the S3 endpoint